Difference Detection Demo
About this Demo
This demo showcases the usage of OneWare Studio and the OneAI Extension for a demo case where two images are compared in order to detect objects in one image given a template. If you are unfamiliar with the OneAI Extension, we recommend to first take a look at our guide Getting Started with One AI. We also recommend to read the Potato Chip Classification Demo, since it goes into more detail than this demo.
OneAI supports multiple images as input to a model and offers different ways to work with them. Overlap difference is one way that may be useful when images can be compared to a reference or template by direct difference between the images. This may be a use case in anomaly detection or quality control when images are taken from the same perspective and position.
Dataset Overview
The dataset is artificially created with our own Image Composition Tool due to the lack of open source datasets. Taking the overlap difference only makes sense when we have a dataset with images that are spatially aligned, i.e. so similar that taking the difference of them is a benefit by cancelling out the background and leaving only relevant parts.
The dataset is created using a time lapse video of a city skyline as background. For the objects to detect, we have two different bird images (one bright, one dark) and two different drone images (one bright, one dark). The background images were taken from the skyline video by skipping some frames, leading to a total of 40 different backgrounds. While one background image serves as reference template, the same background or one frame before/after is taken and 1-4 objects (birds or drones) are randomly placed on it. The objects are 7-10% the size of the image to keep it realistic, and the drones and birds are placed either in the sky or in front of buildings.
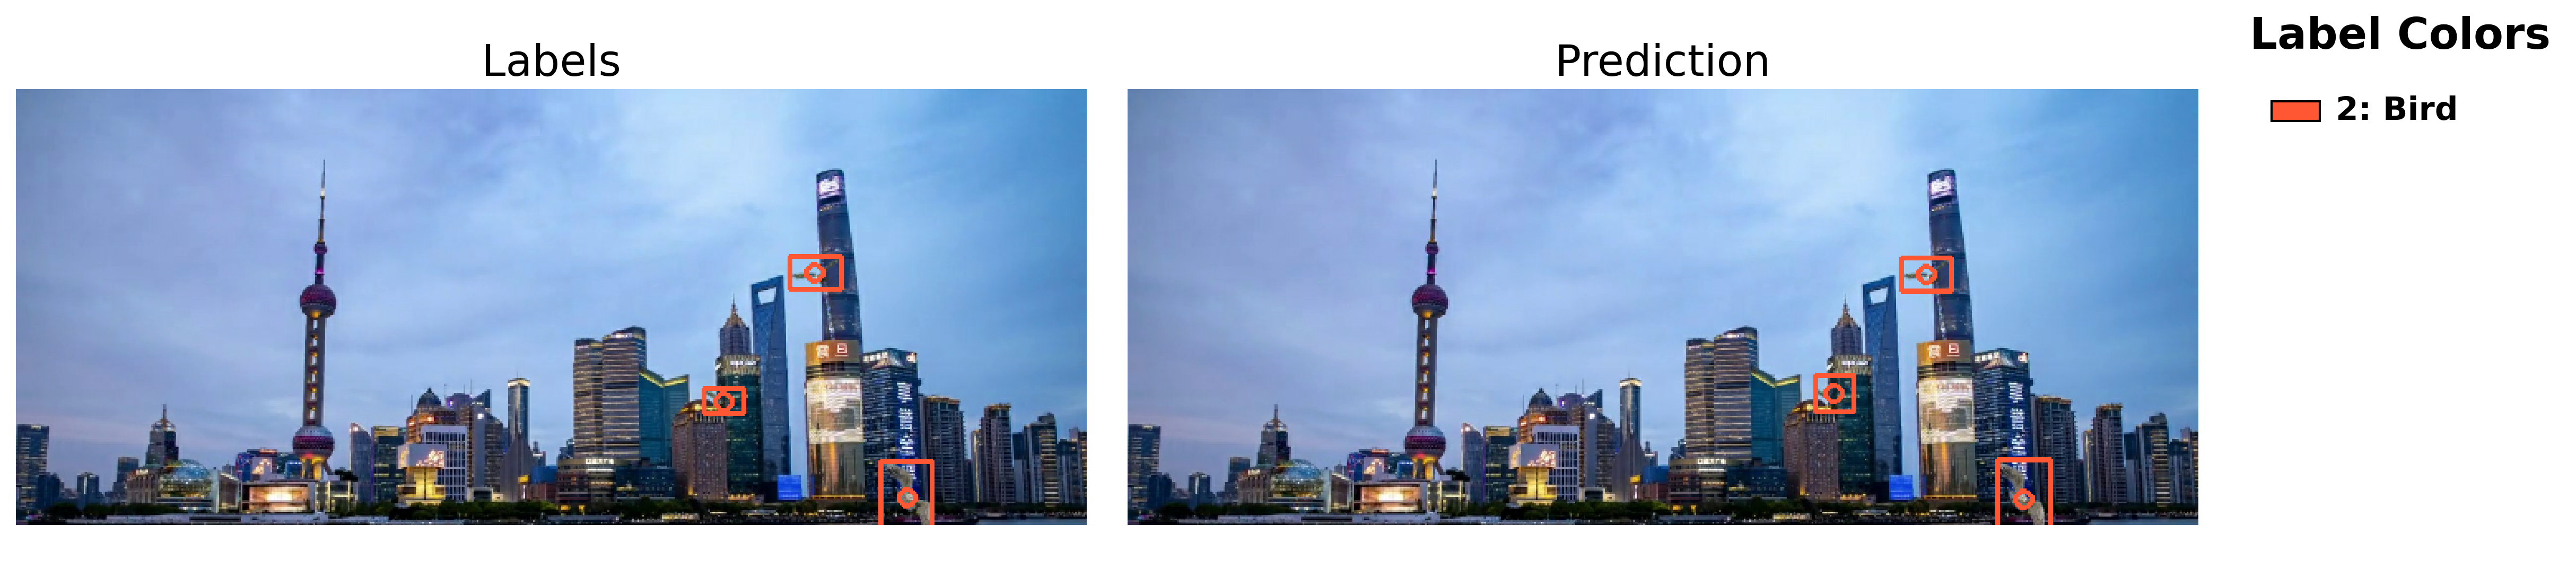
In short, the dataset contains 259 image pairs (one template, one with objects) with overall 340 drones and 199 birds. Here are a few examples from the dataset:
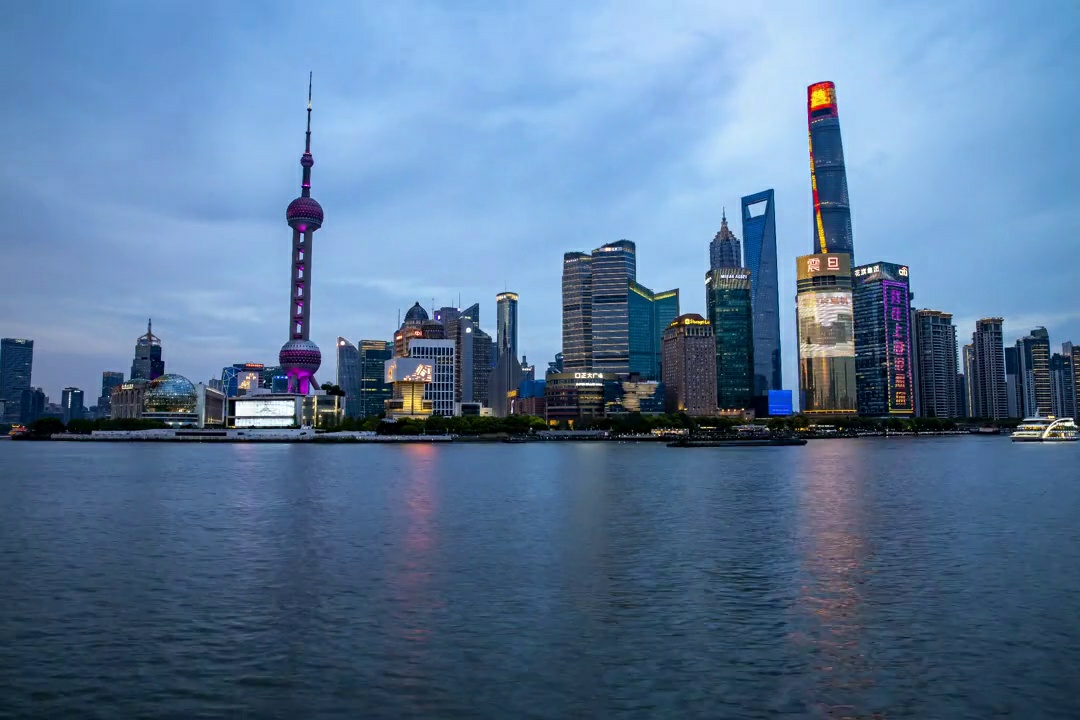
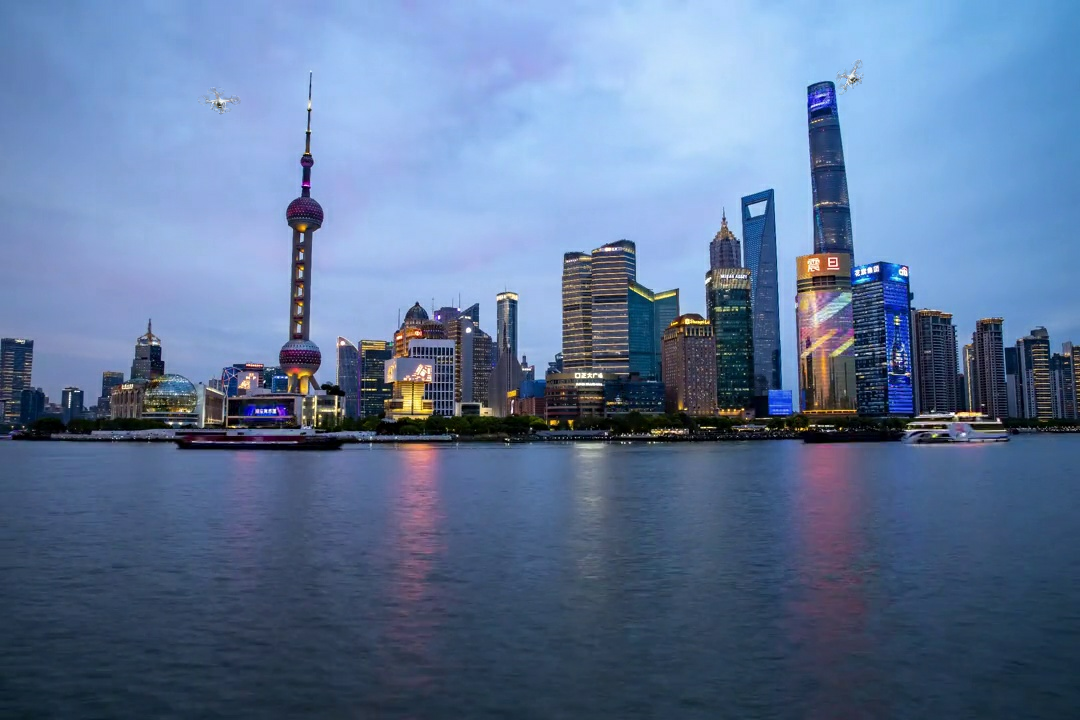
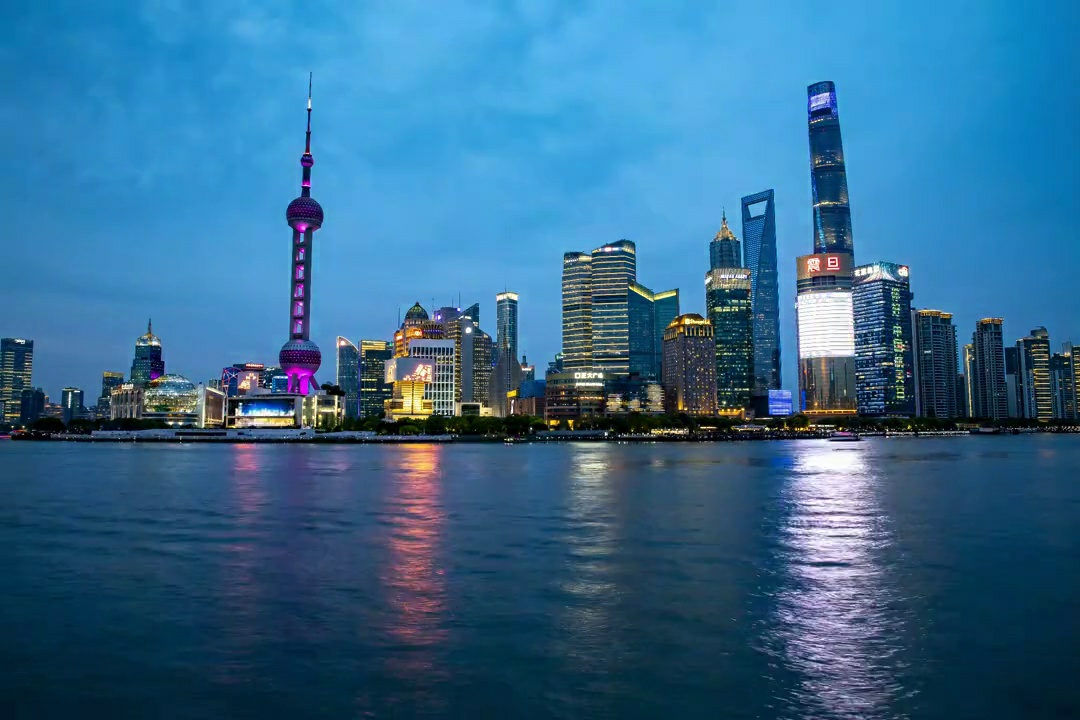
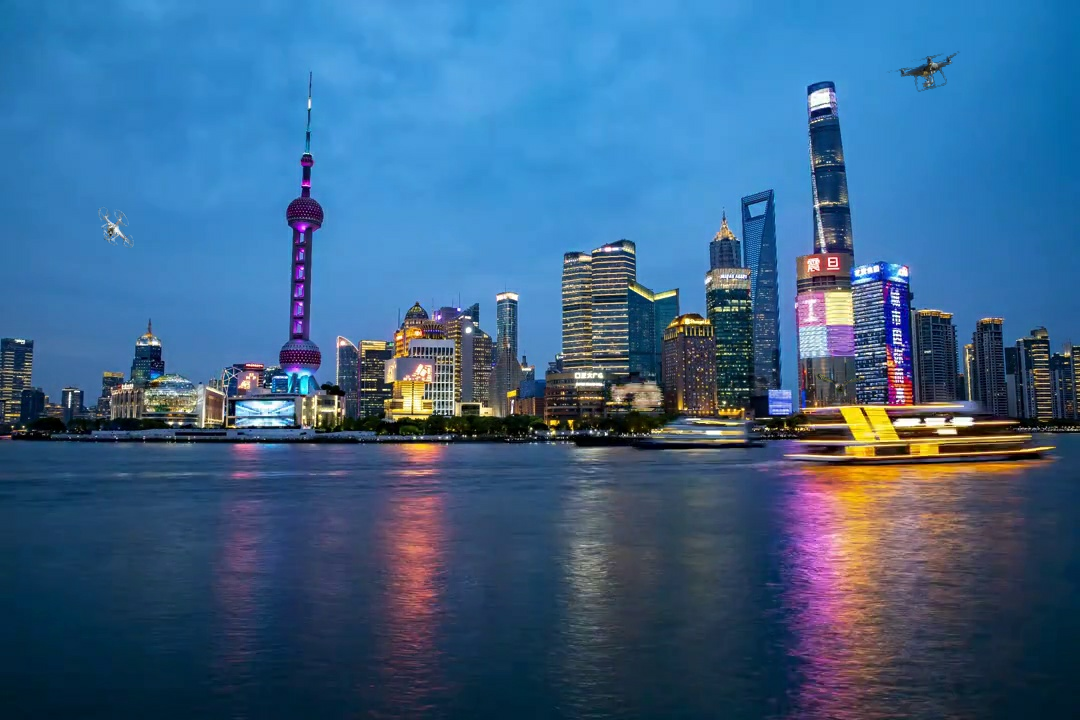
The images above show pairs of reference (template) images on the left and their corresponding test images with added objects on the right.
You can download the dataset here and here (split due to its large size) and the corresponding oneai file for the project here.
Important note: The overlap difference feature only works when the image and label files are correctly named. Images and labels are grouped together by their base name (e.g. img1). So the reference image is then identified by the name extension _temp (e.g. img1_temp.jpg) and the image with objects is identified by the name extension _test (img1_test.jpg). The label naming follows this scheme and since it belongs to the image with objects, the file also needs the _test extension (e.g. img1_test.txt). Example structure:
- Dataset/
- Train/
img1_temp.jpg(reference image)img1_test.jpg(test image with objects)img1_test.txt(labels for test image)img2_temp.jpgimg2_test.jpgimg2_test.txt- ...
- Train/
Setting up the Project
The setup process is similar to the Potato Chip Demo. First, we create a new project and a new AI Generator. Then we open the project folder in a file manager to copy the training data. Since this demo deals with an object detection task, we leave the Mode at Annotation. An important difference is to choose the Fusion Type as Overlap Difference instead of Single Images in the extra setting on the top-right corner next to the Import Button. In the Validation tab, we set up an auto-generated validation split that we set to 20%. We don't have a separate test set for this dataset, so we go to the Test tab and ensure that the Validation Image Percentage is set to 100%.
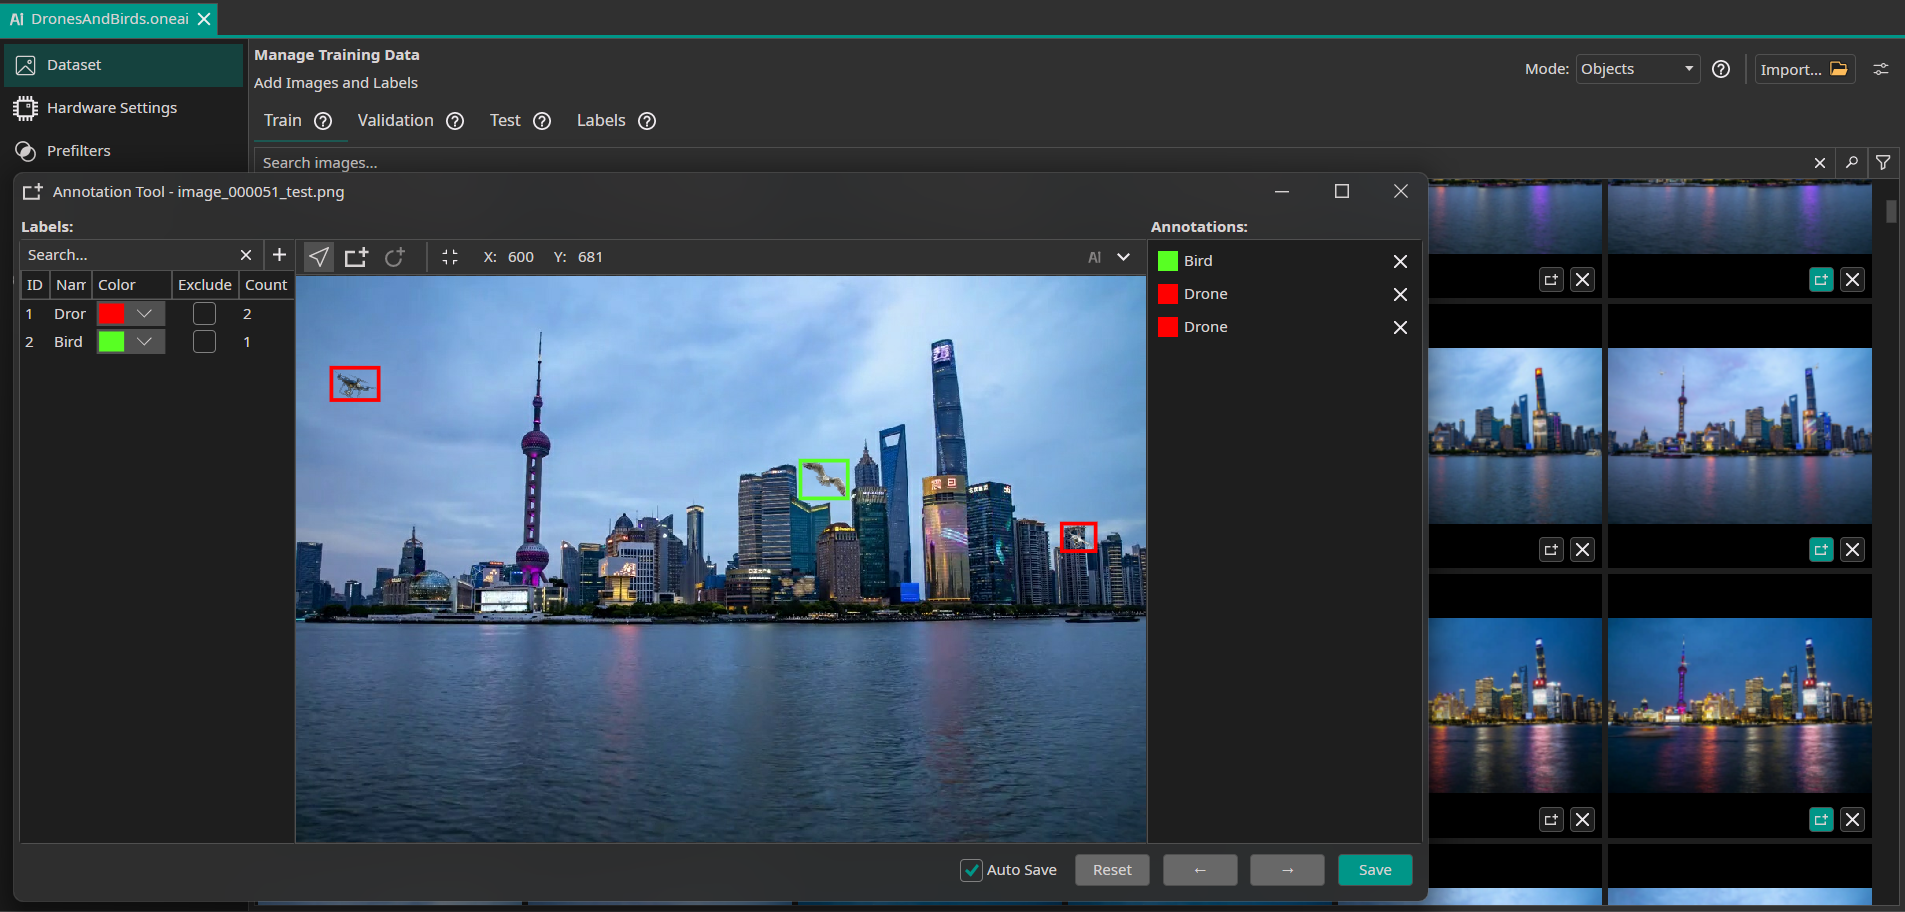
We can verify that everything was set up correctly by checking the annotations of our train images.
It is expected that only the images with _test as file name ending have annotations, since the reference image with _temp extension does not have labels.
Filters and Augmentations
Now, we select the filters and augmentations that we want to use. Though the objects are small, the image size is already relatively small with 648x432, and reducing its resolution would make the objects almost impossible to detect. So we do not reduce the resolution and leave the Resolution Filter at 100%. The only other filter that we are going to use in the demo is a Crop Filter, which cuts the lower water part of the image since we know that there are no objects to detect.
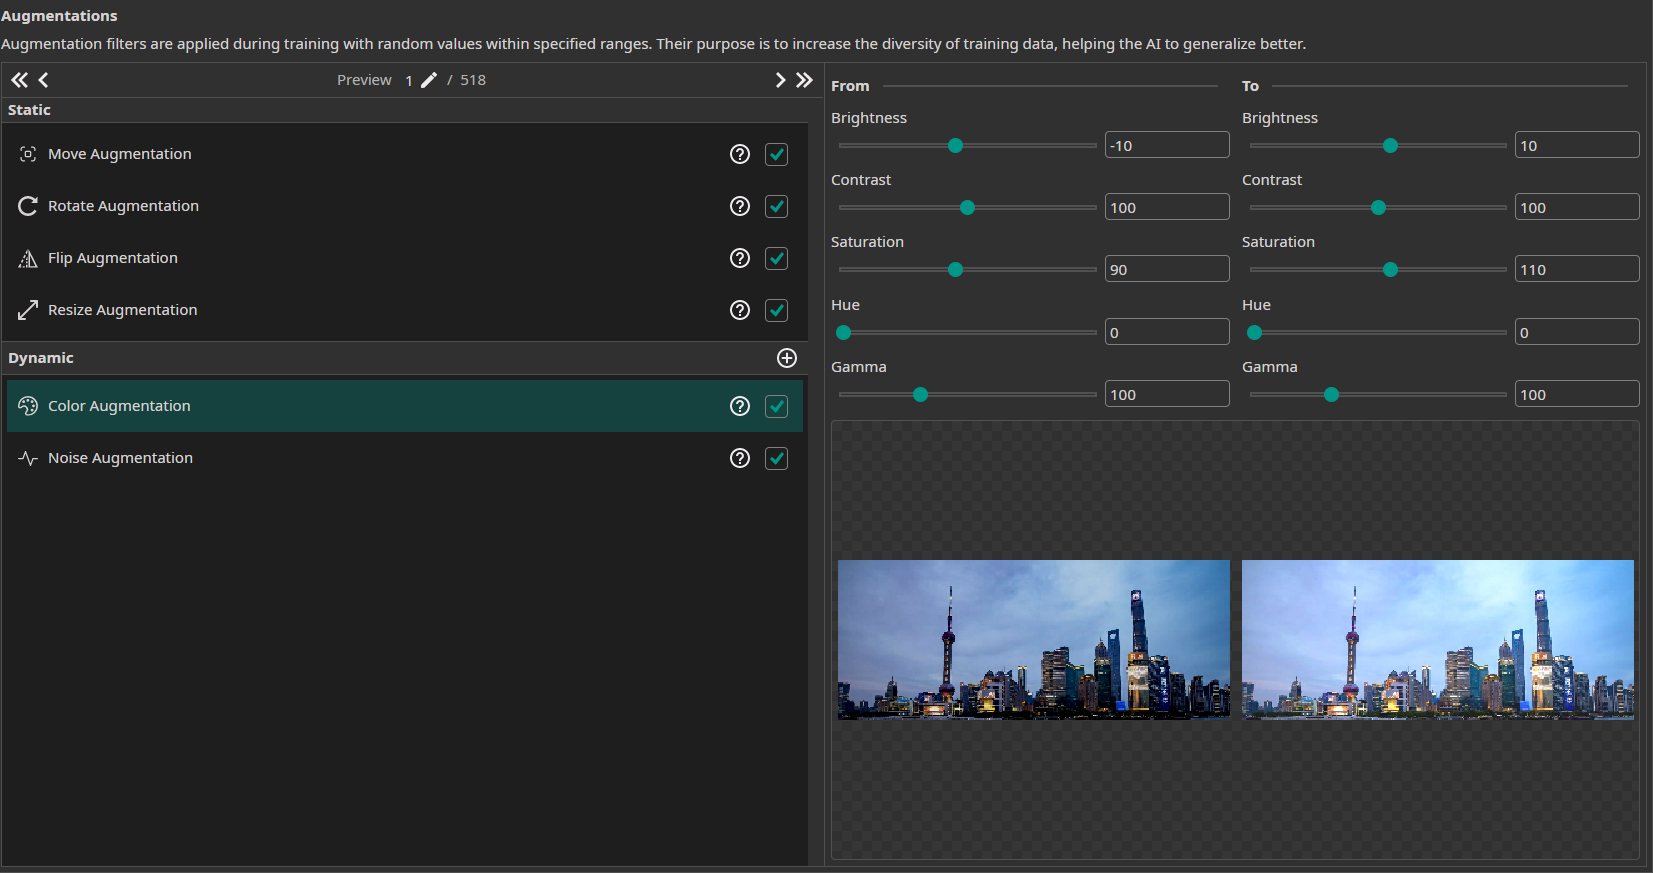
In addition, we use the following augmentations:
- Move Augmentation: We set the amount of shift to ±5% in both directions.
- Rotate Augmentation: We set the rotation range of the rotate augmentation to ±5° since rotational robustness doesn't have a major importance for this demo.
- Flip Augmentation: For this project, we only select horizontal flips. Since the skyline was taken from a bottom view, using vertical flips would change the perspective of the images.
- Resize Augmentation: We vary the size from 90% to 110% in both dimensions to make the model more robust against changes in the object sizes.
- Noise Augmentation: We add a noise augmentation and reduce the settings to 0% and 8%.
- Color Augmentation: We add color augmentation to capture the differing light and sky conditions from the background. Therefore, we choose a slight brightness augmentation from -10% to +10%, contrast augmentation from 85% to 115%, and saturation augmentation from 90% to 110%

Model Settings
Our next step is to configure the model settings. Our goal is to detect and classify the birds and drones, so we select the Prediction Type to Size, Position and Class of Objects. We prefer to have an accurate prediction but don't require it to be perfect, so we set the X/Y Precision to 50% and the Size Precision to 25%. We want to prioritize precision a little bit to reduce falsely detected objects especially in between the buildings, so we choose Prioritize Precision at 60%. Next, we can specify the performance requirements of the model. We set the Minimum FPS to 10 and the Maximum Memory Usage to 25%. Since the model isn't exported to an FPGA, the settings for the Maximum Multiplier Usage and the FPGA Clock Speed aren't used.
Further, we know how the dataset was created so we can estimate the required surrounding area for small objects as (10,10) and for big objects as (15,15) because the surrounding is not very important to the object being detected and due to rotation of the objects we choose a little bit more than the original object sizes.
Next, we need to estimate the difference within the same class. This means here: "How different are the birds (or drones) compared to each other?" In this case, we have for each category one bright-colored and one dark-colored object, but due to it being images simply dropped (with blending) on the image, there are no differing perspectives of them. So we set the Same Class Difference to 50%.
Afterwards, we need to give an estimate for the background variance. In full resolution, the city buildings and changing sky colors create a highly varying background with many details. However, since all images are taken from the same perspective and we reduce the resolution to 60%, the effective background variance is reduced. The lower resolution simplifies some of the fine details while still preserving enough information for object detection. Therefore, we choose a Background Difference of 30%. Though at first glance the task may seem easy, especially the detection and correct classification of the small objects in front of detailed buildings can be very challenging. So we can say the task is placed somewhere between a moderate and a high complexity, and we set the Detect Simplicity to 25%.
In this case, we do not need to create different groups since the drones and birds are very similar in size, color and appearance. So we can leave both labels in the Default Group 1.
Training the Model
Finally, we set up the parameters for the model training. In the Hardware Settings tab we set the Used Hardware to Default GPU.
In the Training tab we need to click on Sync to synchronize our data and existing model trainings with the ONE WARE servers. After that, we create a new training configuration. Object detection tasks tend to need a lot more training than classification tasks, but with the overlap difference we give a lot of information that makes it easier for the model to learn, so we set the training time to 10 minutes. The patience is set to 50% to terminate the training early if there are no further improvements. Since we don't plan to export the model to an FPGA, we don't need to enable quantization.
Finally, we click on the Train button in the top-right corner to start the training. You can monitor the training progress in the Logs and Statistics tabs.
Testing the Model
Though the training shows us the validation metrics f1 score as indicator for the performance of the model, we can now test the model after training for a detailed view. Therefore, we click on the Test Button in the top-right corner. We choose to visualize 5 images and set an IoU threshold of 40% because we care a little more about the objects being found and correctly classified than the perfect bounding box, which is common for small objects as given here. In order to receive a more detailed analysis of the performance, we choose Show Metrics, which gives us the mean average precision as well as the precision per class.
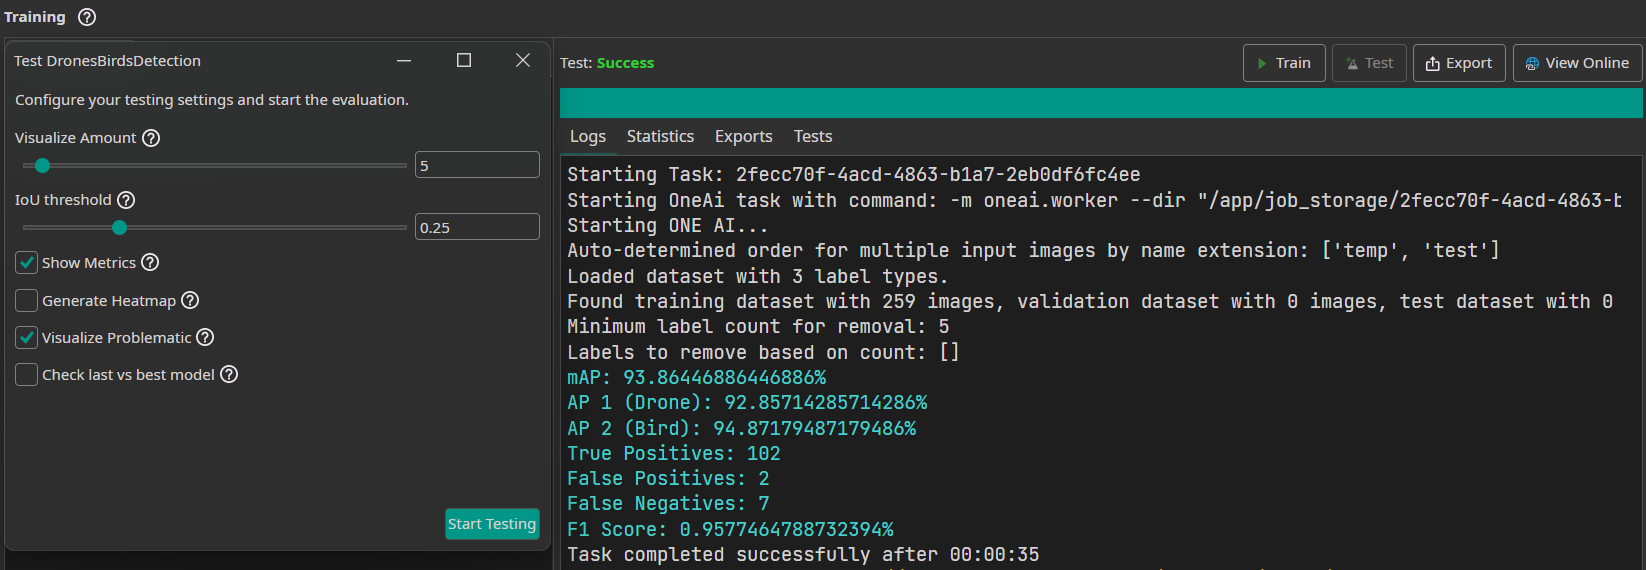
This model receives with the given parameters an F1 score of 95.7%. For comparison, we trained a YOLOv8 model on the same data, preprocessing, and augmentation for 30 epochs (10 minutes). However, since YOLOv8 cannot handle image pairs or compute overlap differences, it was only trained on the single test images containing the objects (without the template images), requiring it to detect small objects against a complex city background without the benefit of a reference template. With this approach, YOLOv8 achieved an F1 score of 56%. This demonstrates that our model's overlap difference method is significantly superior for use cases where spatially aligned images are available, resulting in more than 10 times fewer errors than YOLOv8.
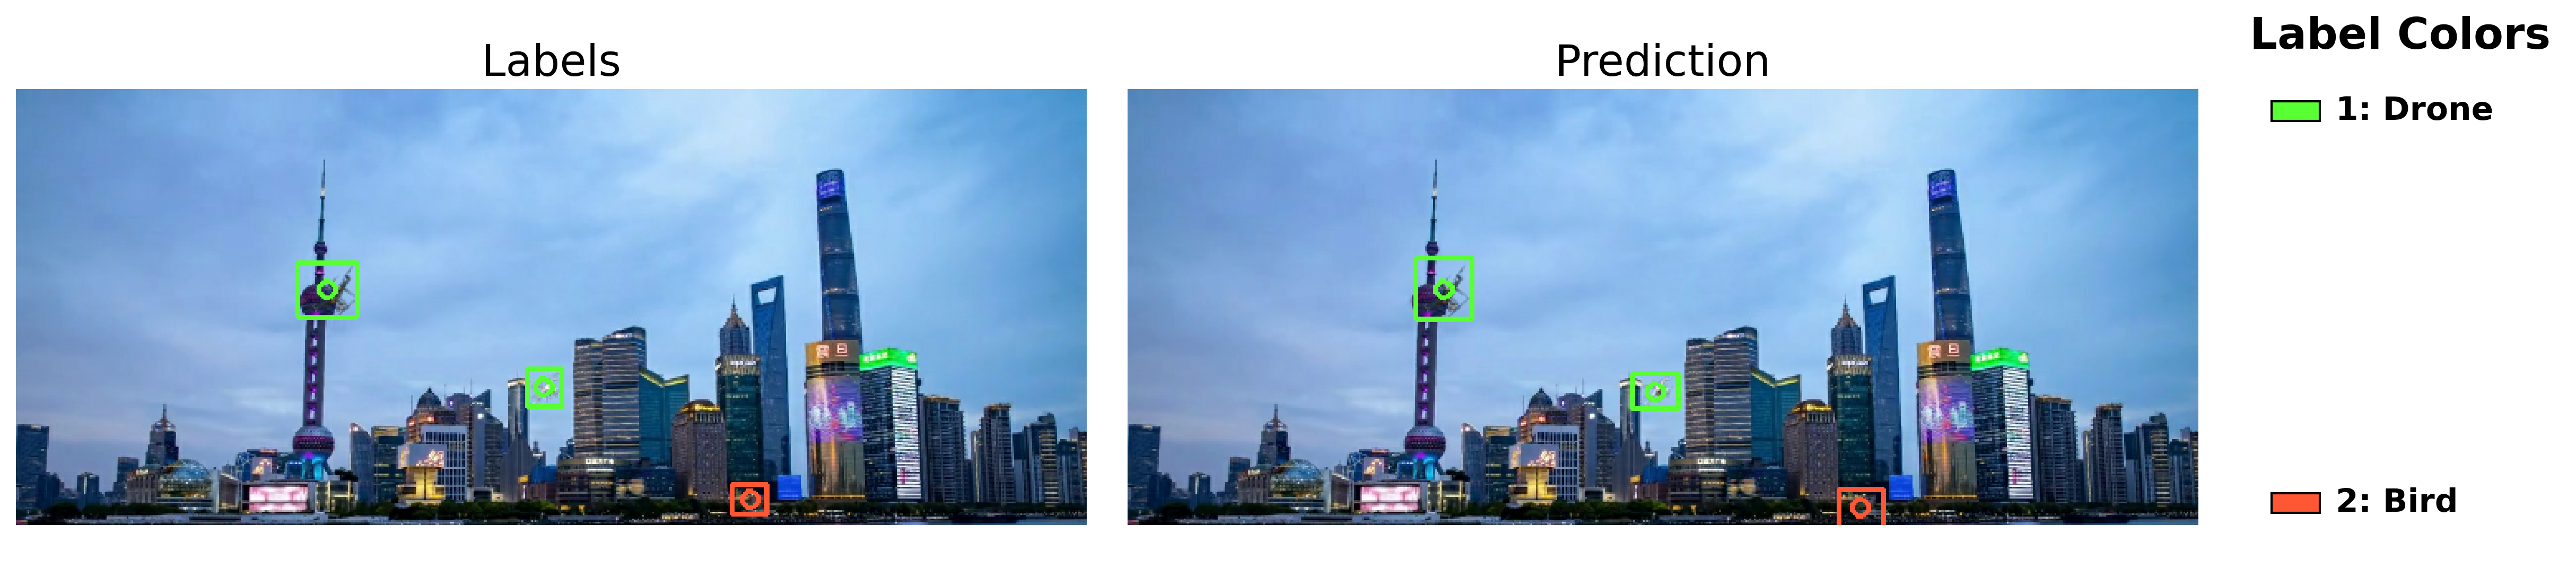
The visualizations from the test process can be seen in the Cloud and reached either by clicking the View Online Button on the top-right corner or by clicking on the link given in the logs. In the Cloud, the results can be seen when clicking under the current project and model under tests: The sample predictions and precision-recall curve can either be downloaded as a zip or simply viewed. For the overlap difference, the results show only the test image with ground truth labels and predictions:
Need Help? We're Here for You!
Christopher from our development team is ready to help with any questions about ONE AI usage, troubleshooting, or optimization. Don't hesitate to reach out!